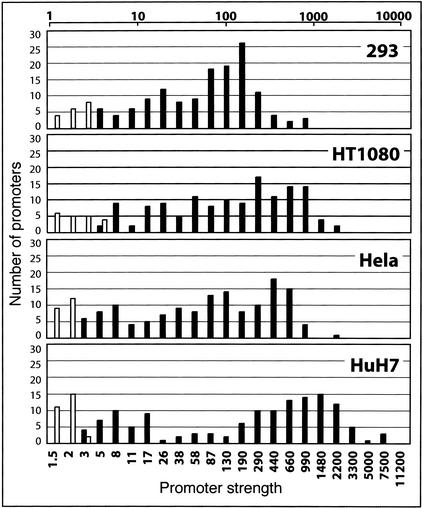
Figure 1.
Distribution of promoter strengths. The distribution of the promoter strengths for the 138 positive clones of the 152 we tested is shown at top on a log scale in the 4 cell types tested. The number of promoters that fall within each bin is shown on the Y axis, and bin boundaries are denoted on the X-axis. We calculated promoter strength as a fold increase of luciferase activity over the negative controls in a given cell type. The black bars indicate promoters that fall above our threshold value for a functional promoter, and the white bars indicate those below that threshold (see Methods). Bins that contain both positive and negative promoters have boundaries that span the threshold value.

