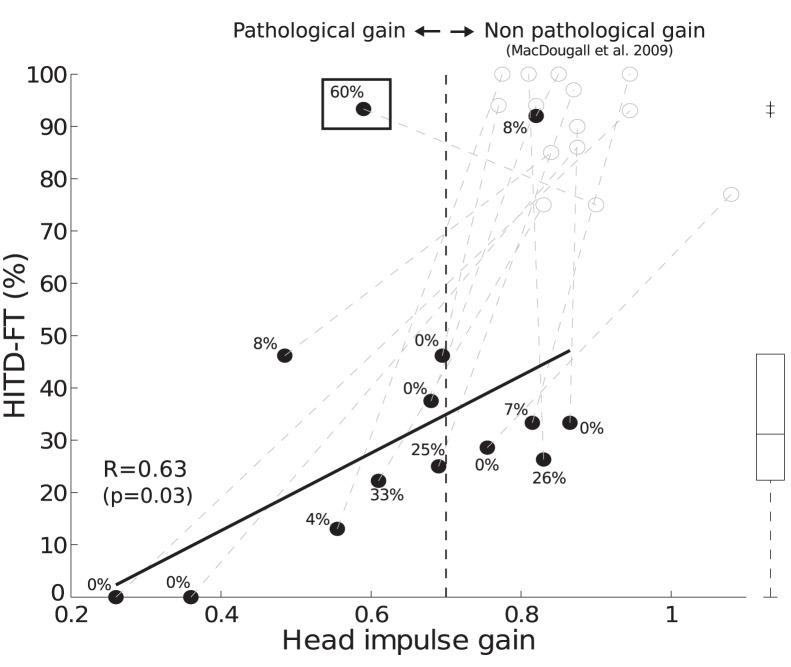
Figure 2. Correlation between vestibulo-ocular reflex (VOR) gain and HITD-FT scores during remifentanil administration.
HITD-FT rate of correct answers and head-impulse gains are shown; each dot represents mean results from one subject, values computed during left and right head rotations were pooled. Empty dots show data for head-impulse gain and HITD-FT scores before remifentanil administration. Black dots represent data during remifentanil administration. Gray dashed lines indicate the changes within each subject. The percentage of covert saccades performed during stimulus presentation is reported for each subject. The black vertical dashed line indicates the threshold for a pathological head-impulse gain (<0.7, in analogy to [11]). For 12/14 subjects, HITD-FT scores and head-impulse gains correlated: low gain, reflecting a deficient VOR, affected the ability of reading during head movements, leading to a low HITD-FT score (solid line, R = 0.63, p = 0.03). Two subjects showed high HITD-FT scores, which fell out of the one-tailed 99% confidence interval of the HITD-FT scores from all subjects during remifentanil administration. These subjects were also the only ones being detected as outliers (see Methods); box shows interquartile range, whiskers extend to the most extreme values not considered outliers (MATLAB standard boxplot). One of these subjects showed a high HITD-FT score with a normal head-impulse gain (right upper corner). The other subject (black box, example B in Figure 1) could trigger “covert” saccades during the stimulus presentation in 60% of the head rotations. The HITD-FT was intact despite a pathological head-impulse gain.

