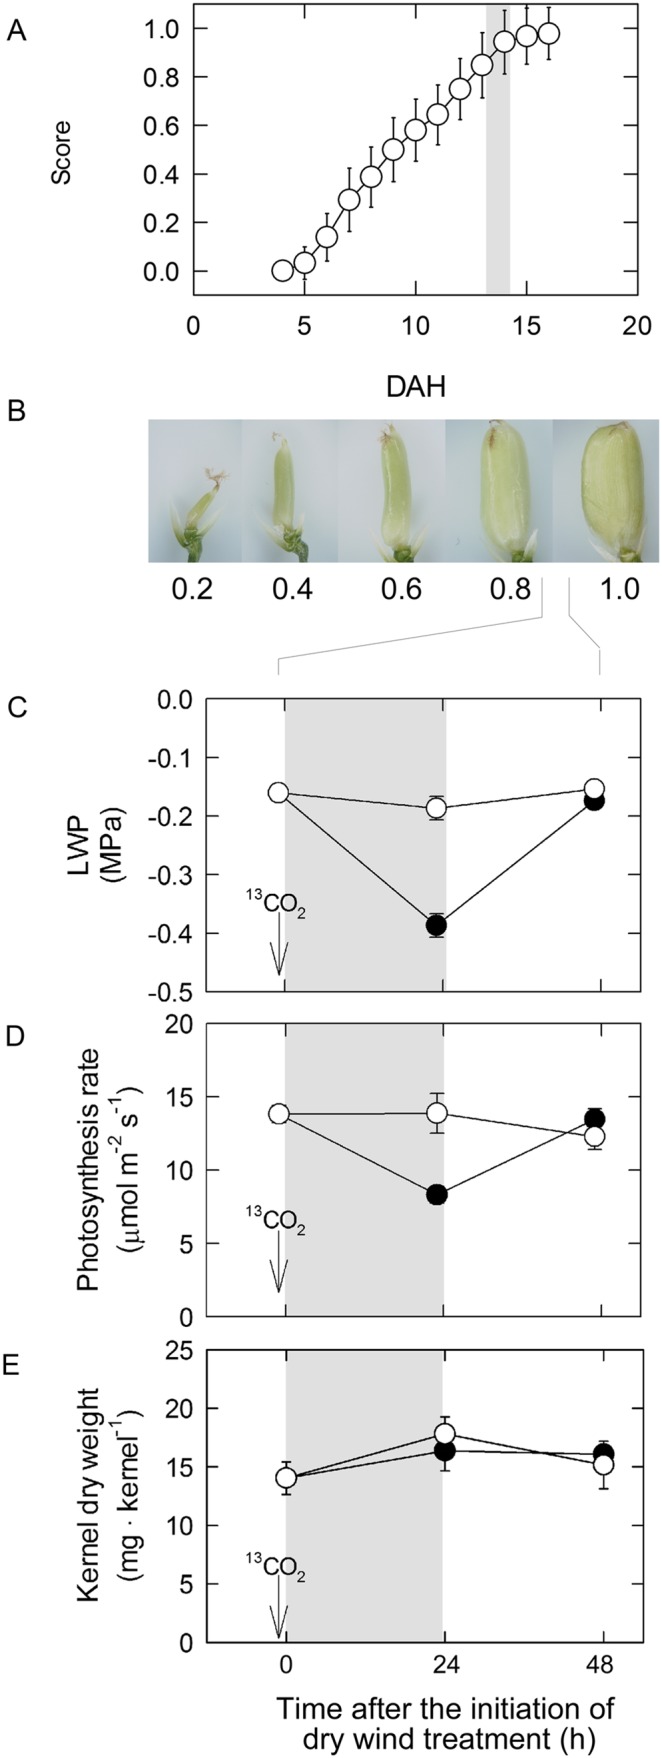
Figure 1. Time course of changes in kernel growth score (A) visually observed through hull; definition of kernel growth scores, 0 through 1.0 (B); and changes in leaf water potential (LWP) (C), photosynthesis rate (D), and kernel weight (E) under 24 h dry wind conditions, starting at 13 days after heading (DAH).

Open and closed circles indicate control and dry wind treatments, respectively. Gray area indicates the 24-h dry wind treatment. For A, each point is the mean ± SD of at least 20 kernels from 4 different plants; for C–E, each point is the mean ± SE of 3–6 samples from different plants.
