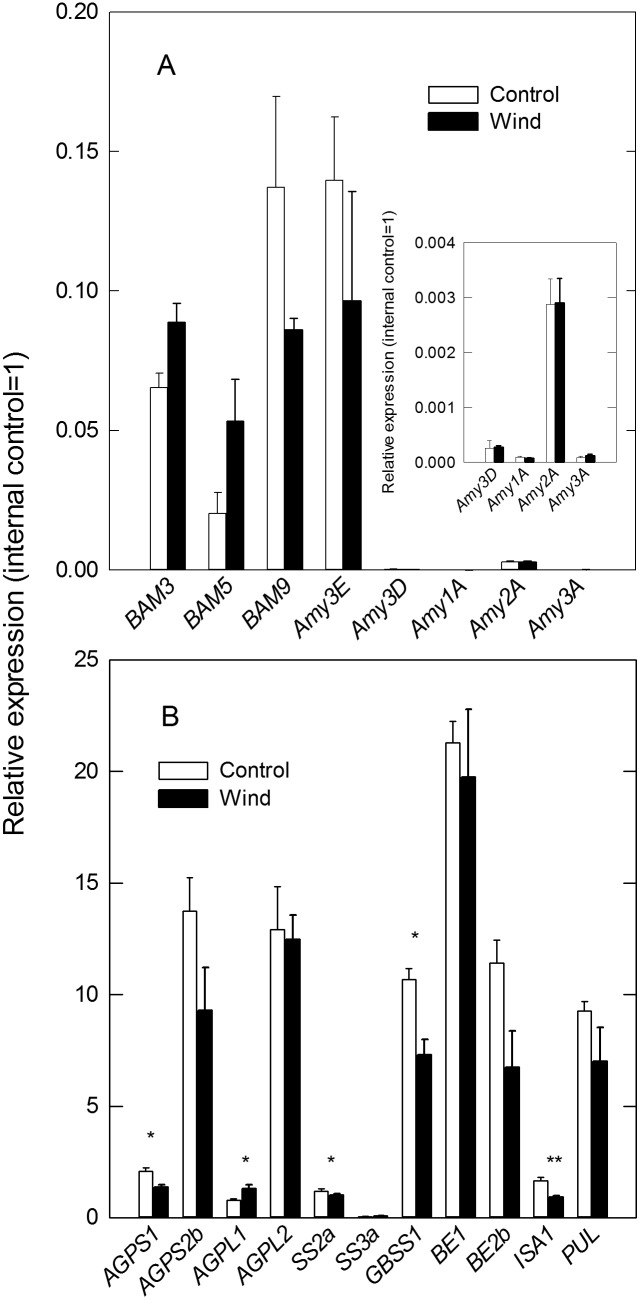
Figure 4. Expression profiling of starch degradation-related genes (A) and starch biosynthesis-related genes (B) in the growing kernels after 24 h of dry wind treatment.
Inset in A is an expansion of the figure showing the expression of four α-amylase-encoding genes. Black and white bars indicate dry wind and control treatments, respectively. Data are the mean ± SE (n = 3) of four inferior kernels pooled at the position in the panicles where the in situ Ψp assay was conducted. Significance at the 0.05 and 0.01 probability levels is indicated by * and **, respectively.

