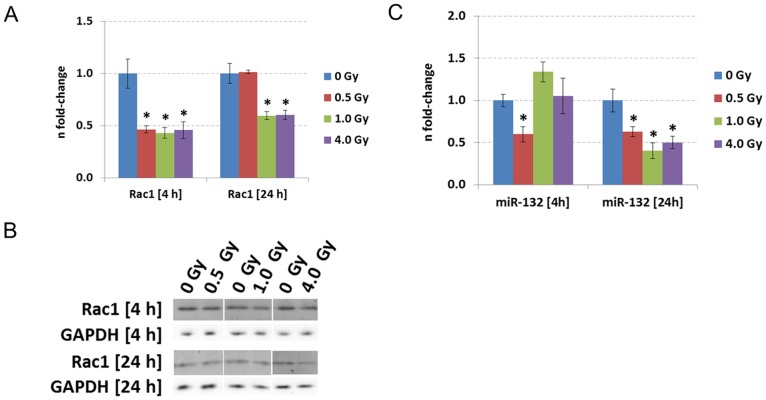
Figure 2. Immunoblotting and miRNA quantification of using HT22 cells.
Data from immunoblotting (A–B) and miRNA quantification (C) associated to the Rac1-Cofilin pathway in HT22 cells irradiated with 0 Gy, 0.5 Gy, 1.0 Gy and 4.0 Gy 4 hours and 24 hours post-irradiation. The columns represent the fold-changes with standard errors of the mean (SEM); n = 3 for immunoblotting, n = 4 for miRNA quantification. The visualisation of protein bands shows the representative change from the biological replicates. *p<0.05; **p<0.01; ***p<0.001 (unpaired Student's t-test). Normalisation was performed against endogenous GAPDH and endogenous snoRNA135 for immunoblotting and miRNA quantification, respectively.

