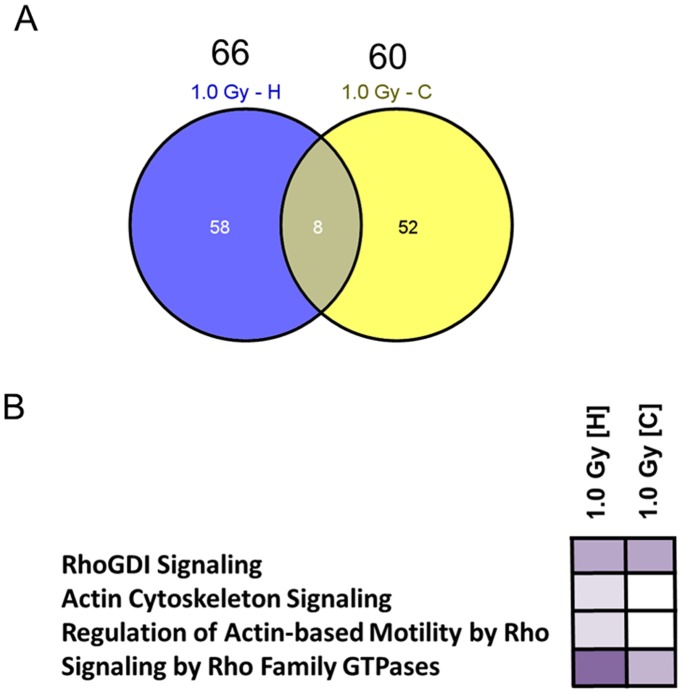
Figure 3. Mass spectrometry-based proteomics of the hippocampus and cortex of irradiated NMRI mice.
Venn diagram of all deregulated and shared hippocampal [H] and cortical [C] proteins from global proteomics analysis using doses of 0 Gy and 1.0 Gy 24 hours post-irradiation (A). Hippocampus: n = 4 and cortex: n = 5. The number above each dose shows the total number of deregulated proteins at this dose. Associated cytoskeletal signalling pathways of all deregulated proteins using the Ingenuity Pathway Analysis (IPA) software in hippocampus [H] and cortex [C] are shown in (B). Higher colour intensity represents higher significance (p-value) whereas all coloured boxes have a p-value of ≤0.05; white boxes have a p-value of ≥0.05 and are not significantly altered. p-values: RhoGDI signalling (hippocampus: 0.000535, cortex: 0.000459), actin cytoskeleton signalling (hippocampus: 0.049, cortex: 0.189), regulation of actin-based motility by Rho (hippocampus: 0.0389, cortex: 0.261), signalling by Rho Family GTPases (hippocampus: 0.00000271, cortex: 0.00166).

