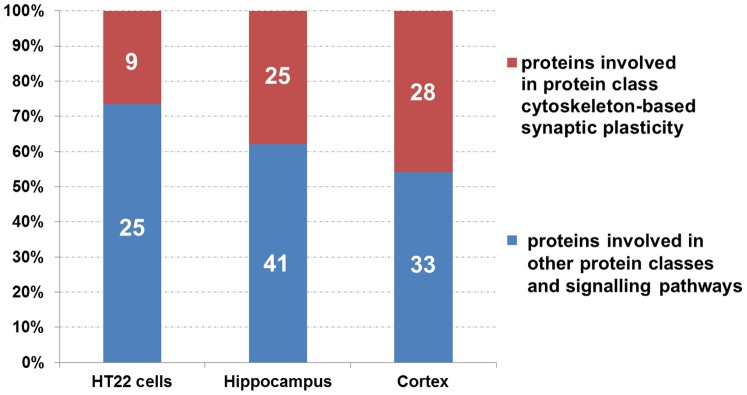
Figure 5. Mass spectrometry-based proteomics - comparison of the in vitro and in vivo data.

The number of deregulated proteins from the in vitro and in vivo global proteomics analysis (1.0 Gy, 24 hours post-irradiation) belonging to the protein class “cytoskeleton-based synaptic plasticity” (Table S1 and S2) compared to all deregulated proteins in the respective cellular/organ system. The figure shows that 9 (26.5%), 25 (37.9%) and 28 (45.9%) proteins from all deregulated proteins of HT22 cells, hippocampus and cortex, respectively, can be grouped into this class. This class is based on the protein affiliations into sub-protein classes obtained from the PANTHER software (PANTHER protein class) as shown in Table S1 and S2 (PANTHER protein classes are highlighted in orange) involving cytoskeleton -associated processes, G-protein -associated processes and cell adhesion -associated processes.
