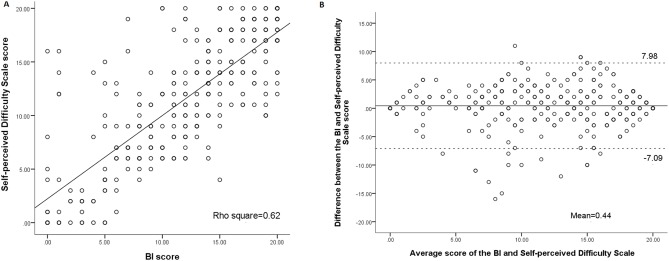
Figure 1. Correlation (A) and Bland-Altman plot (B) for the BI and Self-perceived Difficulty Scale.

Bland-Altman method for plotting the scores of the difference between the BI and Self-perceived Difficulty Scale. The 2 dashed lines define the limits of agreement (mean of difference ±1.96 SD).
