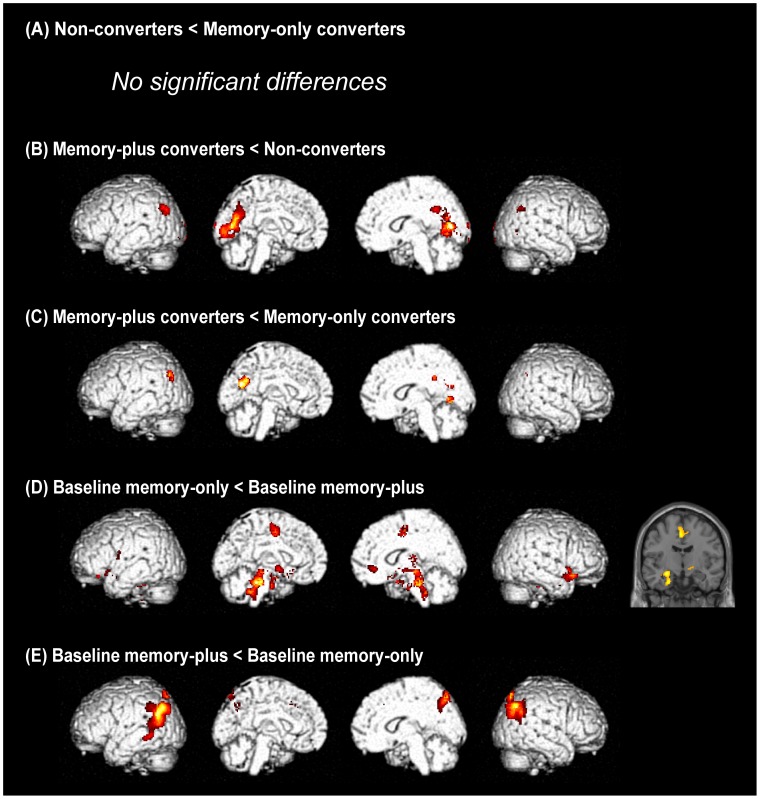
Figure 3. Group comparisons of regional cerebral glucose metabolism at baseline.
(A) to (C) show the results of comparisons between patient groups with baseline Clinical Dementia Rating (CDR) 0, and (D) and (E) show the results of comparisons between groups with baseline CDR 0.5. Rendered images are shown in the order of the left lateral, left medial, right medial and right lateral. The left side of a coronal section corresponds to the left side of the brain.

