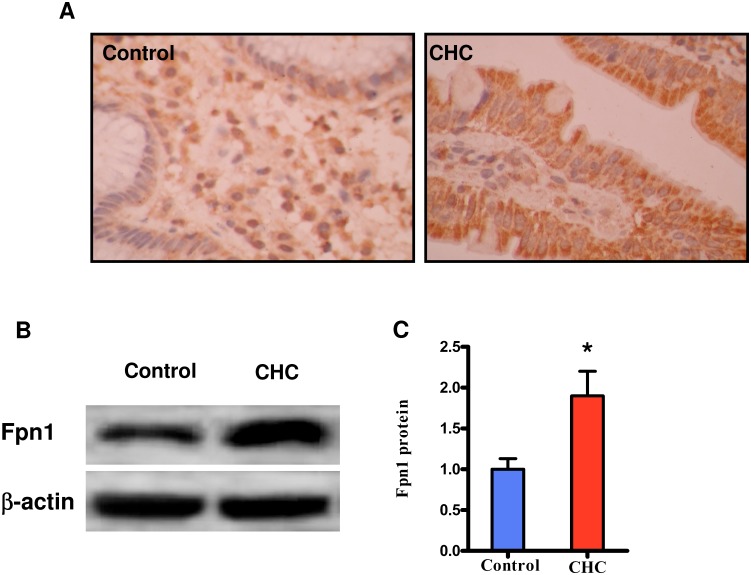
Figure 3. The protein expression of duodenal Fpn1.
CHC (N = 15) and Control (N = 12). The protein expression of duodenal Fpn1 determined by immunohistochemistry (A), and Western blot (B), respectively. (C) Quantification of protein levels by Western blot in the two groups. *P<0.05 relative to control group.

