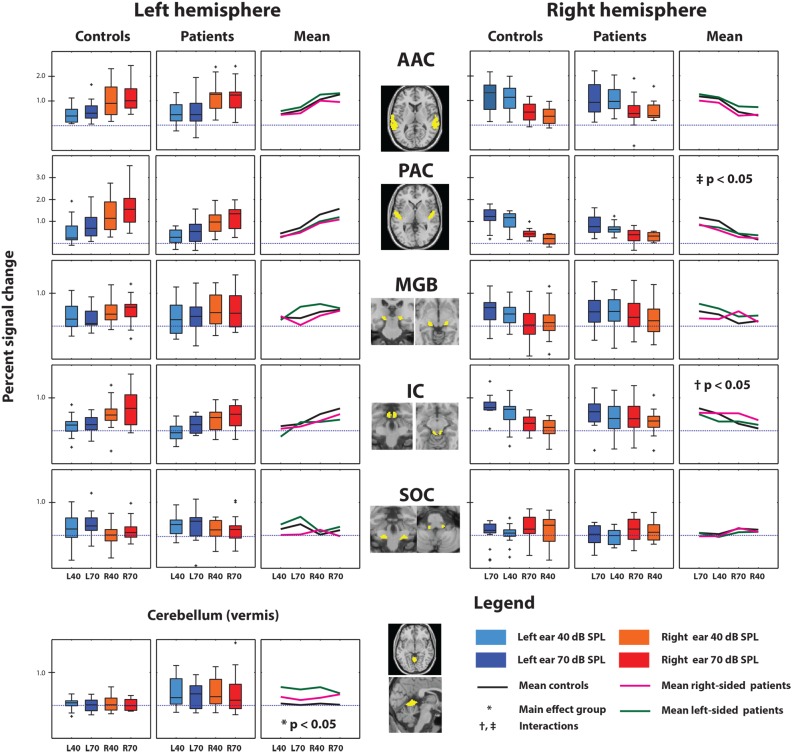
Figure 4. Region of interest analysis.
The percentage signal changes measured in each ROI of the left and right hemisphere (AAC, PAC, MGB, IC and CN) and the vermis of the cerebellum for both subject groups. The location of each ROI is indicated in yellow on cross-sections of the brain. The responses to the four experimental conditions are shown as box plots for each group separately. For each group, the mean per condition is visualized in the line plot next to the box plots.

