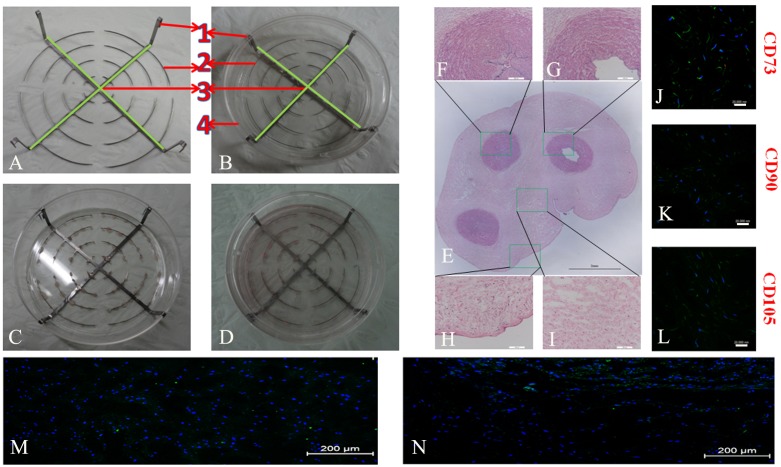
Figure 1. The repeated culture frame and structure of umbilical cord.
The repeated culture frame is shown in figures A and B, and figures C and D display in cultures. HE stained cross-section of an umbilical cord (E) shows the veins (F), arteries (G), amnion layer (H) and Wharton’s jelly (I), respectively. The right panel shows the IF staining of CD73 (J), CD90 (K), and CD105 (L) in the Wharton’s jelly. Figures M and N show uniform cell distribution in the suspended tissue block and cell distribution owards the bottom in adherent culture for 7 days, respectively. Scale bars: 2mm in E; 200 um in F–I; 20 um in J–L; and 200 um in M and N.

