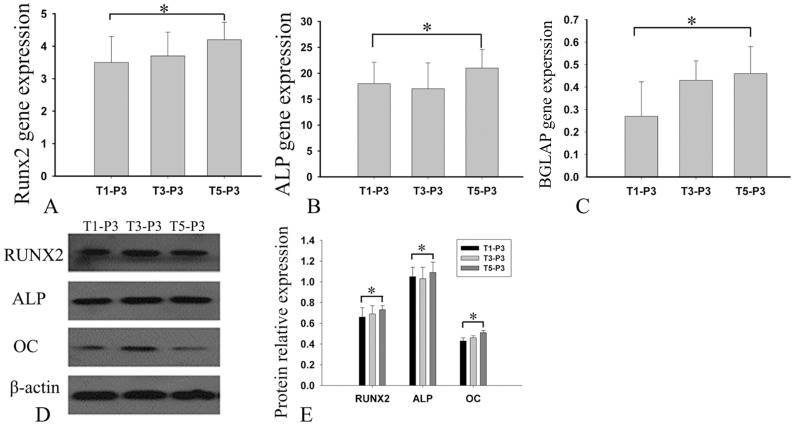
Figure 5. Expression of osteogenic differentiation markers.
After a 14-day incubation in osteogenic medium, the expression of osteogenic differentiation markers by T1-P3, T3-P3 and T5-P3 cells was assayed using real-time RT-PCR (A–C). The y-axes (A–C) represent the expression rate of the target genes relative to that of 18S. At the same time, cells were lysed for western blotting. The expression of the osteogenic differentiation markers was detected in the three batches of cells (E). Bars represent the mean ± SD, n = 3. *p>0.05.

