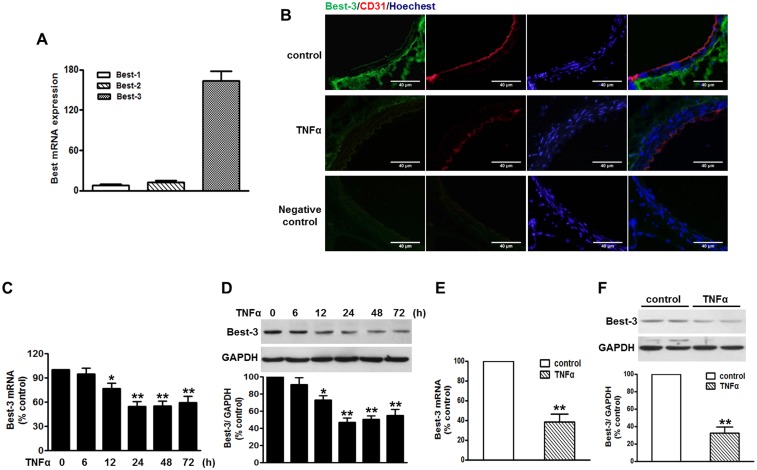
Figure 1. TNFα decreased Best-3 expression in endothelium.
(A) quantitative PCR analysis of Best-1, Best-2 and Best-3 mRNA expression in HUVECs. n = 6. (B) immunofluorescent staining of Best-3 (green) and CD31 (red) and Hoechst (blue) in thoracic aorta of mice after TNFα challenge for 3 days. n = 4–6. Scale bars, 40 µm. (C, D) HUVECs were stimulated with TNFα (10 ng/ml) for different times as indicated. Quantitative PCR (C) and western blot (D) results show a time-dependent decrease of Best-3 expression. *P<0.05, **P<0.01 vs. untreated group, n = 5. (E, F) quantitative PCR (E) and western blot (F) analysis of Best-3 expression in MAECs isolated from mice after treatment mentioned in method section, respectively. **P<0.01 vs. control group, n = 8.

