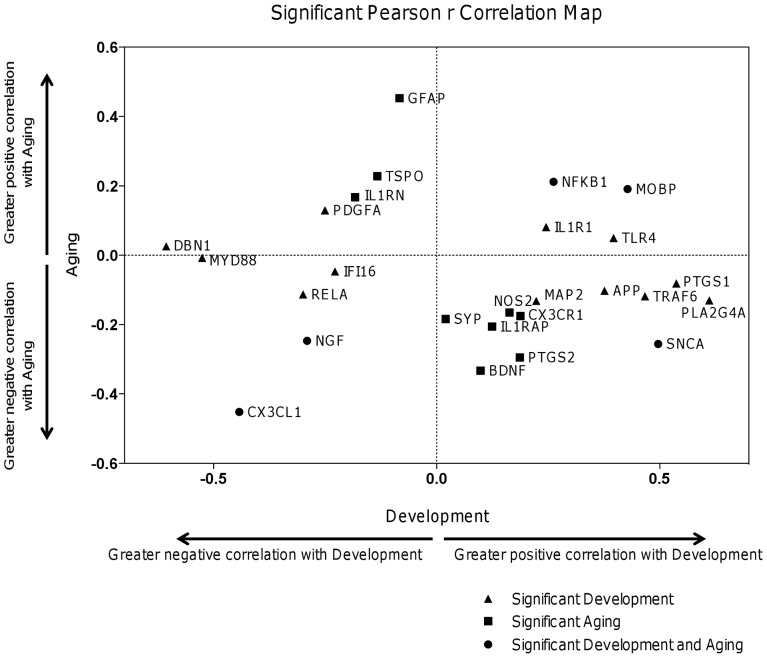
Figure 2. Statistically significant correlations with age in Development and/or Aging intervals.
Graphical identification of genes with statistically significant (p<0.05) Pearson r correlations in expression level during Development (x axis) and Aging (y axis) intervals. Gene expressions negatively correlated with age during Development are to the left, while genes positively correlated are to the right of the vertical line. Genes that were negatively correlated with age in the Aging group are below the horizontal line, while genes positively correlated are above line. Development: n = 87; Aging: n = 144.

