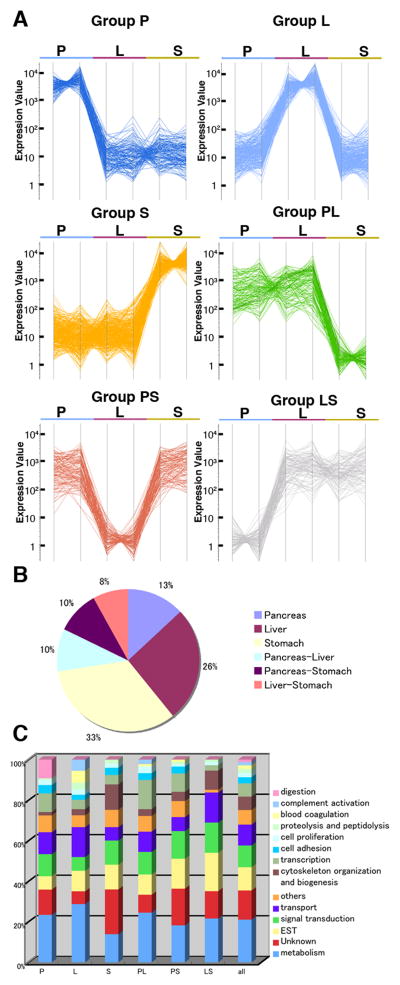
Fig. 1.
Clustering analysis of genes expressed in the embryonic pancreas, liver, and stomach. (A) Six expression groups generated by K-means clustering analysis. Individual line represents the expression level of a given gene in the pancreas (P), liver (L) or stomach (S). Abbreviations: PL, Pancreas and liver; PS, pancreas and stomach; LS, liver and stomach. (B) A chart indicating the percentages of six groups, which are represented by a total of 912. (C) Percentages of highly represented GO terms for each cluster.

