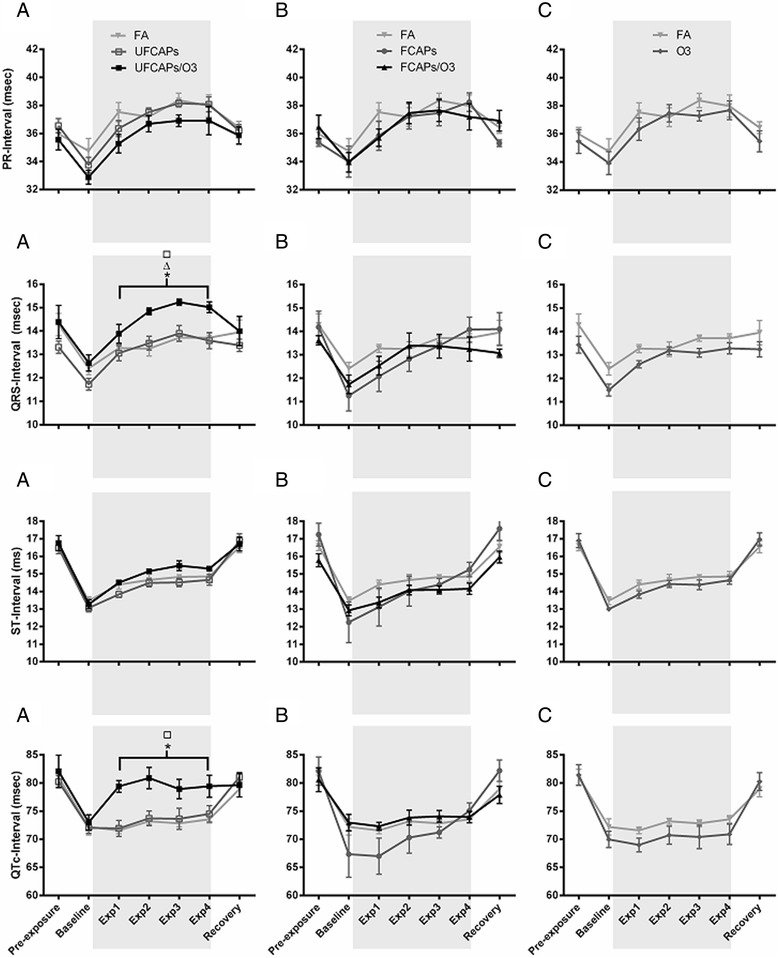
Figure 2.

Electrocardiogram effects before, during and after exposure to CAPs alone or with O 3 . All animals were placed in the chambers and allowed to acclimate for 1 hr before the exposure began (Baseline) and then exposed for 4 hrs (shaded area). All animals experienced a decrease in PR interval, QRS complex duration, ST interval and QTc from pre-exposure to baseline; these changes likely corresponded to the change in HR. Although both PR and ST intervals increased in all groups during hour-1, 2, 3, and 4 of exposure (Exp1, Exp2, Exp3 and Exp4), there were no differences in either of these parameters among any of the groups. QRS also showed an increasing trend during exposure in all groups; however only mice exposed to UFCAPs + O3 had a significant increase in QRS and QTc when compared to FA (Column A.). There were no significant effects of FCAPs, with or without O3, or O3 alone at any time points (Column B. and C., respectively). Bracket indicates that each hour of the exposure period is significantly different. Values are mean ± SEM. p < 0.05; *significantly different from FA, ∆ significantly different from UFCAPs alone, □ significantly different from O3 alone (n = 6).
