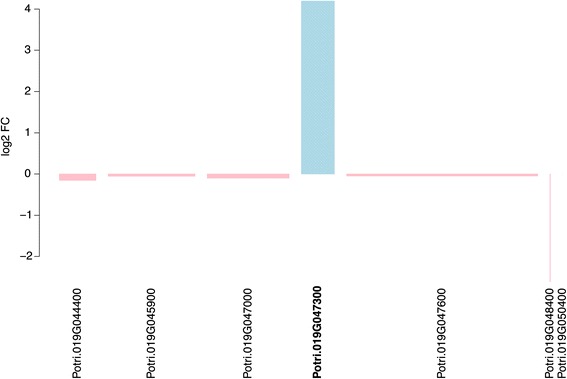
Figure 6.

Bar graph showing differential expression of seven candidate genes from the sex determination locus of Populus tremuloides [ 24 ]. The width of each bar indicates the mean expression level of each gene relative to the gene with the highest expression (Potri.019G047600), which had an expression value of 240, such that narrow bars represent low expression and wide bars high expression. The y-axis indicates the log2 fold-change between male and female trees. Expression values represent variance stabilising transformation normalised read counts. Genes displaying higher expression in females are shown in pink and those with higher expression in males in blue. The gene model identifier for the only one of these genes that was identified as significantly differentially expressed in the RNA-Seq data is marked in bold text.
