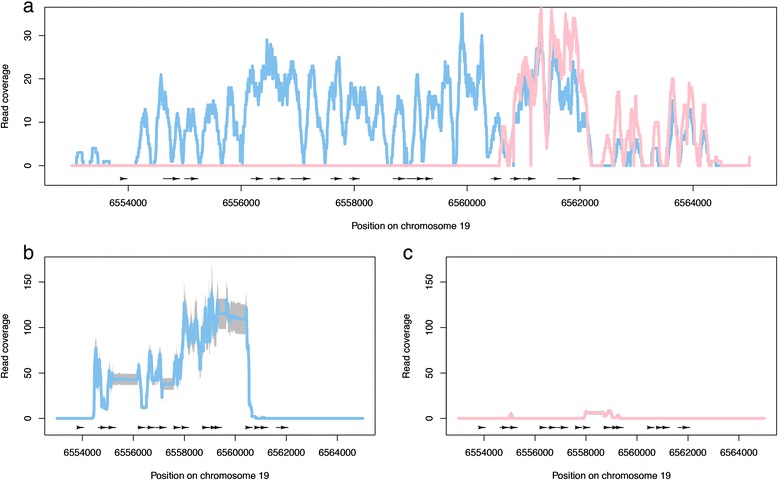
Figure 7.

Genomic DNA and RNA-Sequencing read coverage (y axis) for the region of chromosome 19 (x axis) including Potri.019G047300. (a) Read coverage of uniquely mapping genomic DNA reads from a male (blue, 229.1) and female (pink, 349.2) individual. Black arrows represent exons with arrow direction indicating strand. (b,c) Read coverage of uniquely mapping RNA-Sequencing reads for male (b, n = 8) and female (c, n = 9) individuals. The coloured line represents the average per base pair read coverage across all individuals with grey indicating ± two standard deviations.
