Figure 3.

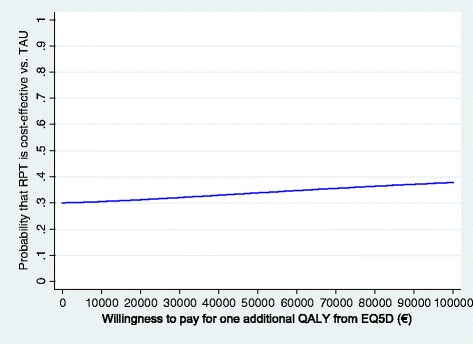
Cost-effectiveness acceptability curve: RPT versus TAU; societal perspective; effectiveness measured on the EQ-5D-based QALYs.

Cost-effectiveness acceptability curve: RPT versus TAU; societal perspective; effectiveness measured on the EQ-5D-based QALYs.