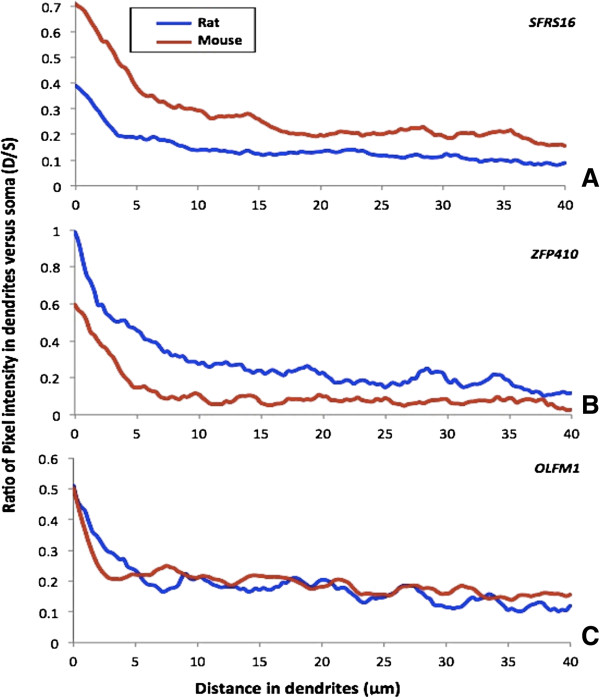
Figure 4.

Quantified In situ hybridization signal shows species-specific localization in dendrites. Graphs represent the ratio of in situ signal in dendrites versus soma (D/S) as a function of the distance (from soma toward the dendrites). (A) The probe against SFRS16 transcript shows higher dendritic localization in mouse neurons than in rat neurons. (B) The probe against ZFP410 transcript shows higher dendritic localization in rat neurons than in mouse neurons. (C) The Probe against OLFM1 transcript shows similar level of dendritic localization in both rat and mouse neurons.
