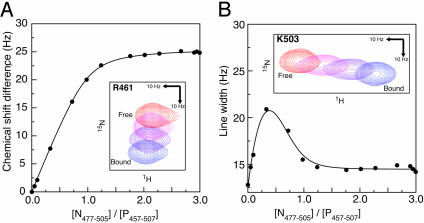
Fig. 3.
Quantitative analysis of the interaction between P457–507 and N477–505. (A) Determination of the dissociation constant (Kd). The figure shows the changes in the chemical shift of the backbone amide 15N resonance for residue R461, observed during titration of P457–507 with N477–505. The solid line represents the fitted model (Eq. 1). For this resonance, the fitted parameters were (δb - δf) = 25.7 Hz, and Kd = 12.2 μM. (Inset) Relevant section of the 2D 15N–1H heteronuclear sequential quantum correlation spectra, with points 1, 4, 5, and 14 of the titration displayed. (B) Determination of the dissociation rate constant (koff). The figure shows changes in the linewidth of the backbone amide 1H resonance for residue K503, observed during titration of P457–507 with N477–505. The solid line represents the fitted model (Eq. 2). For this resonance, the chemical shift difference (δb - δf) between the free and bound state is 52 Hz, and the fitted parameters were Δνf = 12.5 Hz, Δνb = 14.5 Hz, and koff = 670 s-1. Inset shows the relevant section of the 2D 15N–1H heteronuclear sequential quantum correlation spectra, with points 1, 4, 5, and 14 of the titration displayed.

