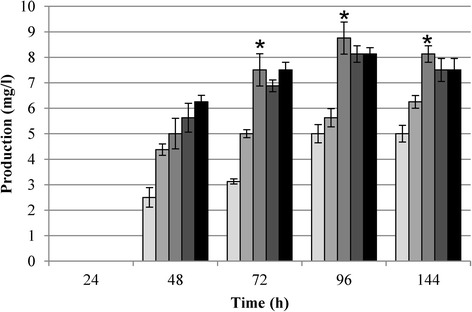
Figure 2.

NAI-107 production in P0.1 (lighter gray bars), P0.5 (light gray bars), P5 (gray bars), P15 (dark gray bars) and P30 (black bars) media. The NAI-107 presence in the extracts was confirmed by LC-MS. The values were determined with a NAI-107 calibration curve (Additional file 1: Figure S3), as described in MM. Standard deviation was calculated from three independent bioassays. Asterisks indicate the phosphate concentration that allowed the maximum production.
