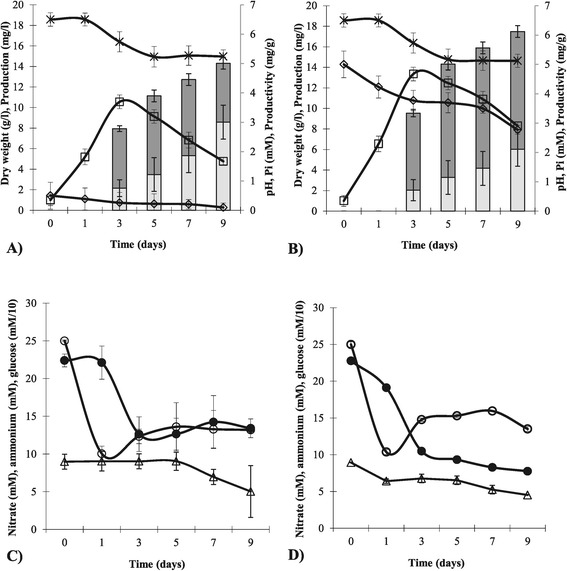
Figure 4.

Microbispora sp. growth in P0.5 and P5 cultures. Cell dry weigth (white squares), NAI-107 production (dark gray bars), NAI-107 productivity (light gray bars), Pi (white diamonds) and pH (black crosses) of P0.5 (A) and P5 (B) cultures are shown. The values of production and productivity were standardized with a NAI-107 calibration curve (Additional file 1: Figure S3) as described in MM. Nitrates (white circles), ammonium (black circles) and glucose (white triangles) were monitored during the growth in P0.5 (C) and P5 (D) media. Initial concentrations of glucose, ammonium and nitrate were 110, 25 and 25 mM, respectively. Standard deviation was calculated as average of three technical and two biological replicates. The NAI-107 presence in the extracts was confirmed by LC-MS.
