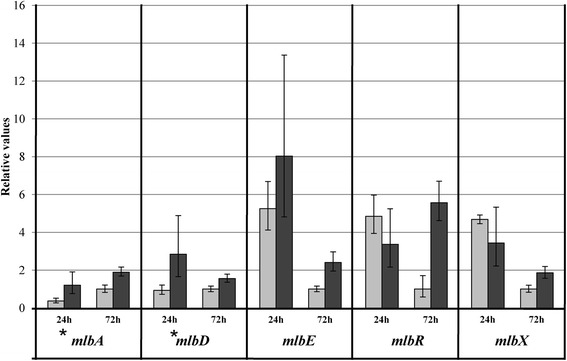
Figure 5.

Quantitative RT-PCR of selected mlb genes of Microbispora sp. after 24 and 72 h of incubation in P0.5 (light gray bars) and P5 (dark gray bars) media. Minimum and maximum relative values, calculated from three independent experiments, are reported as error bars. Relative values were normalized using hrdB gene as endogenous gene. Asterisks indicate genes slightly induced by Pi after 24 h of growth.
