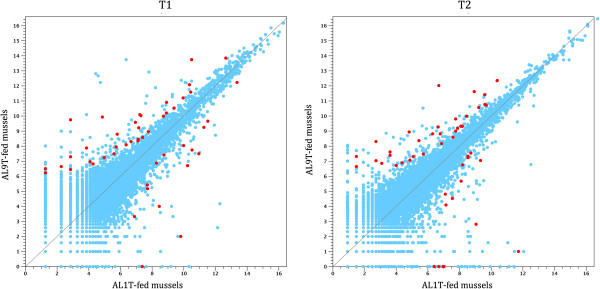
Figure 2.

Gene expression profiles at the early (T1) and late (T2) phase of PSP contamination. Scatter plots displaying gene expression profiles at T1 and T2; gene expression values (displayed as log2 normalized read counts) are plotted for the AL1T-fed (X-axis) and AL9T-fed (Y-axis) samples. Genes identified as putative PSP biomarkers by the Kal’s Z-test on proportions at both time points are highlighted.
