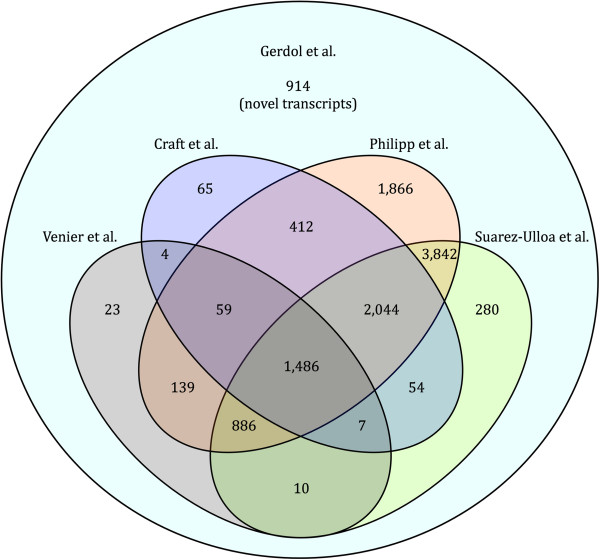
Figure 3.

Comparison between the recent sequencing approaches in M. galloprovincialis. Venn diagram summarizing the overlap between the M. galloprovincialis reference transcriptome generated in the present work, Mytibase (Venier et al., 2009) and the pyrosequencing datasets produced by Craft et al. (2010), Philipp et al. (2012) and Suarez-Ulloa et al. (2013). Numbers shown in the graph correspond to the number of contigs showing a positive mapping hit in each sequencing set.
