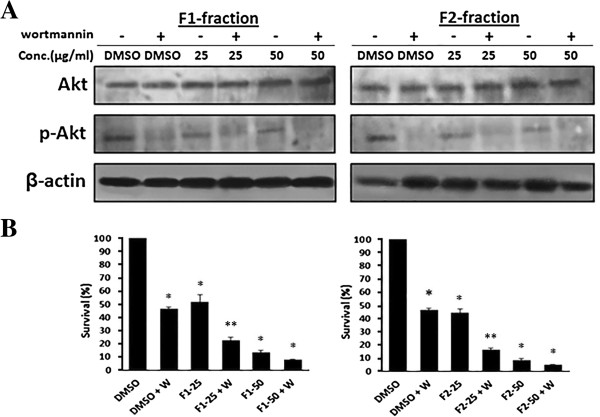
Figure 7.

Effect of the combined treatment of F1 or F2 with wortmannin on MDA-MB-231 cells. (A) MDA-MB-231 cells were treated with 25 or 50 μg/ml of F1 or F2 or DMSO for 48 in the presence or absence of 1 μM wortmannin for 24 h. Cells were lysed and blotted for Akt and pAkt. (B) Effect of F1 and F2 fractions on MDA-MB-231 cell survival at concentrations of 25 or 50 μg/ml for 48 hours in the presence or absence 1 μM wortmannin. Inhibition of cell survival was assessed using the WST-1 assay. Data are expressed as% survival of cells. Data denote mean ± SEM from three independent experiments. *denotes P < 0.05 versus control (0.5% DMSO) and **denotes P < 0.05 versus F1-25 or to F2-25 groups as measured by one-way ANOVA.
