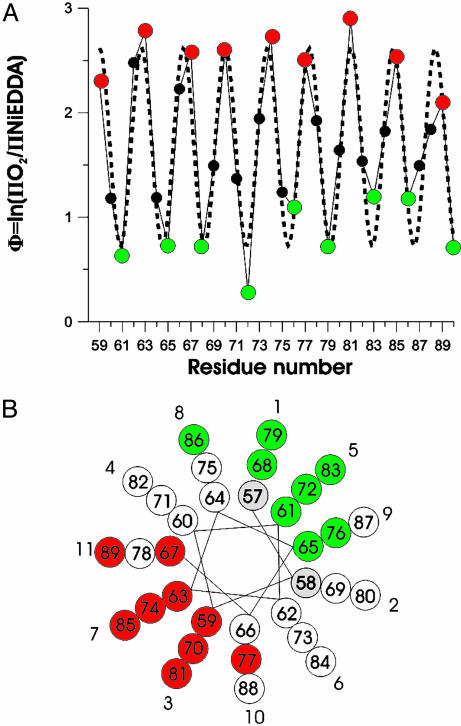
Fig. 4.
Secondary structure and topology of R1-labeled α-synuclein. (A) The ratios of the O2 and NiEDDA accessibilities are summarized by the contrast parameter Φ. High Φ values indicate lipid-exposed sites (red) whereas low Φ values indicate solvent-exposed sites (green). The dashed line indicates the best fit to a cosine function resulting in a periodicity of 3.67 aa per turn. (B) When residues are plotted on a helical wheel with a periodicity of 3.67 aa per turn, lipid-exposed sites (red) are on one side whereas solvent-exposed sites (green) lie on the opposite side. White circles denote residues with Φ values that are neither maxima nor minima. Residues shown in gray have not been tested. Repeat position (numbered 1–11) are indicated.

