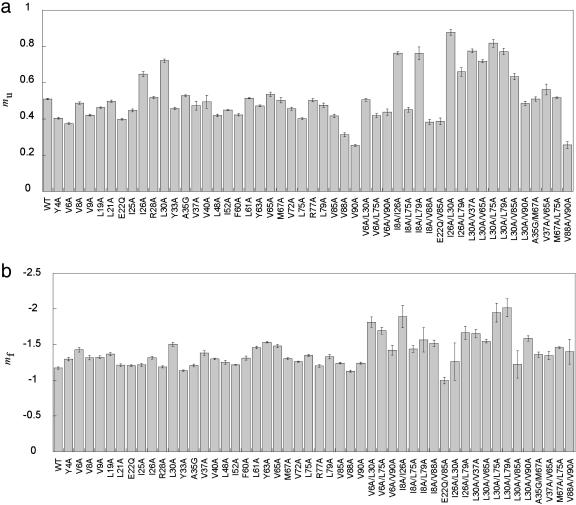
Fig. 4.
Experimental mu (a) and mf (b) values for wild-type and mutant S6. The m-values were determined by standard procedures from the linear regions of the chevron plots, excluding regions of downward curvature that are sometimes seen at high denaturant concentrations (11). Residues in the specific nucleus display the highest m-values, indicative of alterations of the folding trajectory and loss of residual structure in the denatured ensemble for mu and mf, respectively.

