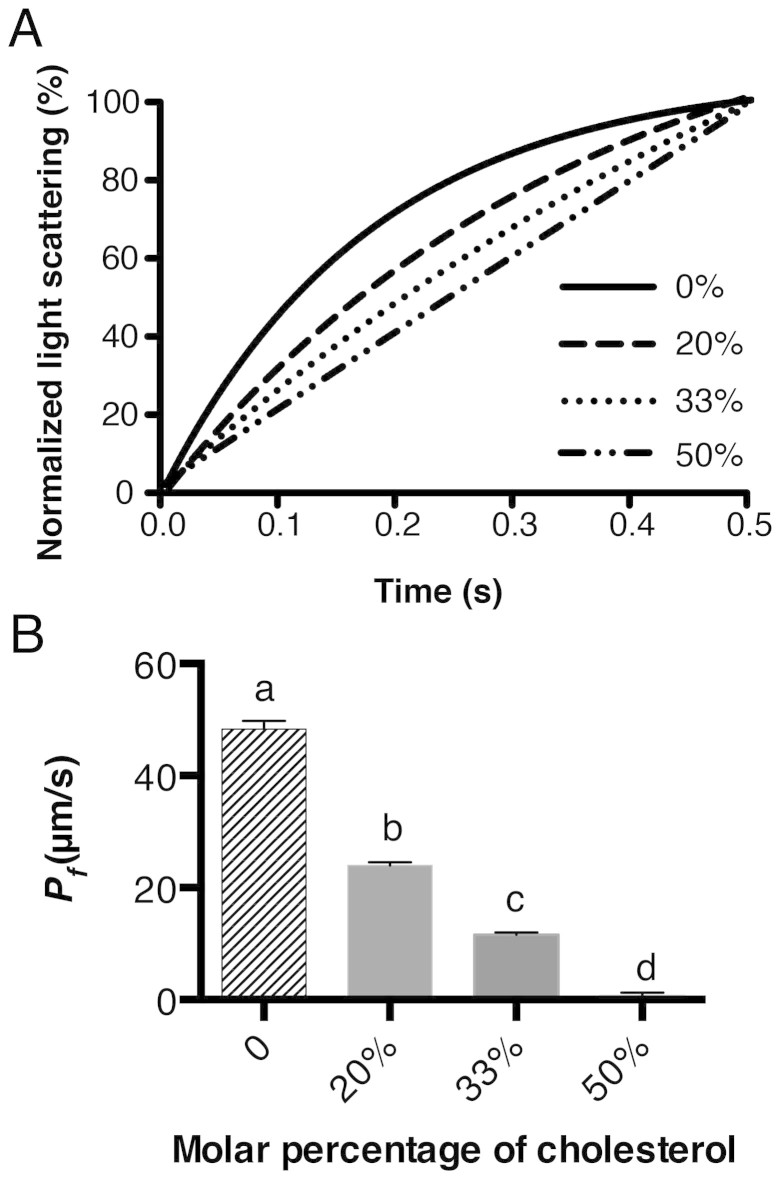
Figure 2. Effect of Chol concentration on the water permeability of the lipid bilayer.
(A), average of the fitted curves of 8–10 independent measurements. (B), calculated Pf (mean ± SD) value of water permeability of corresponding samples. Letters a, b, c, d are significantly different from each other (P < 0.0001), determined by two-tailed student's t-test. See Table S2 for detailed numbers of calculations.

