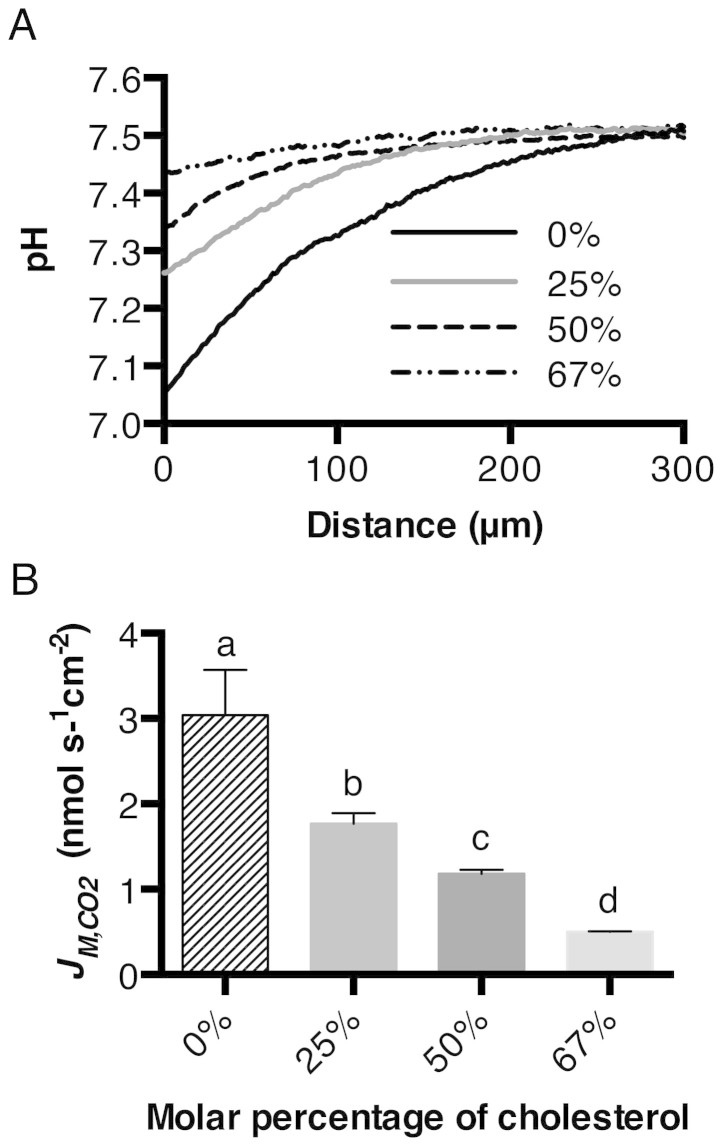
Figure 4. Effect of Chol concentration on the CO2 flux across the lipid bilayer.
A, pH profiles in response to CO2 flux across the lipid bilayer with different molar percentages of Chol. B, calculated CO2 flux across the lipid bilayer with different Chol from the slope of the pH curve within 50 μm distance from the formed membrane. The JM,CO2 values are given as means ± SD (n = 3–6). Letters a, b, c, and d are significantly different from each other (P < 0.05), as determined by a two-tailed student's t-test.

