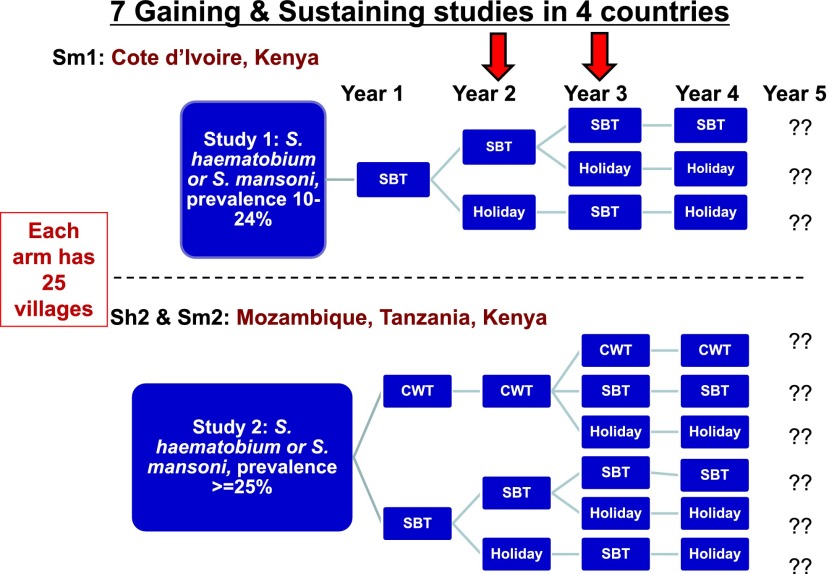
Fig. 4.
Diagram of the large SCORE field studies of Gaining control (starting prevalence of >/= 25%) and Sustaining control (starting prevalence of 10%–24%). Each arm is comprised of 25 villages or schools and the red arrows indicate that some of the studies are finishing their Year 2 and others are finishing their Year 3 of four years of MDA and 5 years of data collection. CWT = Community-wide Treatment; SBT = School-based Treatment. These studies are being done in four African countries: Cote d’Ivoire, Kenya, Tanzania and Mozambique. For more detail please see the SCORE website: http://score.uga.edu

