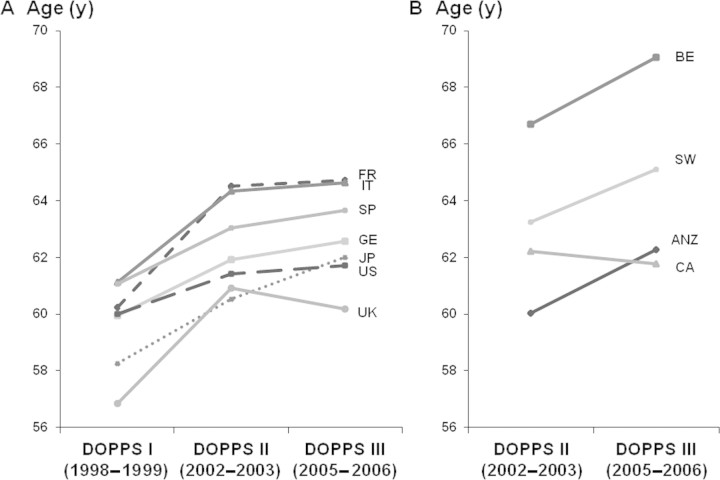
Figure 1.
Mean age of Dialysis Outcomes and Practice Patterns Study (DOPPS) participants at study entry across DOPPS phases. On the basis of cross sections of participants in DOPPS I (1998 through 1999, with the exception of the United States (US), where most DOPPS I participants were enrolled in 1997; n = 8542), DOPPS II (2002 through 2003; n = 9117), and DOPPS III (2005 through 2006; n = 8161). Panel A depicts countries that participated in DOPPS I, II, and III; panel B depicts countries that participated only in DOPPS II and DOPPS III. P value for comparison between DOPPS I and DOPPS II: <0.05 in all countries except the United States; P value for comparison between DOPPS II and DOPPS III: <0.05 in Belgium (BE), Japan (JP), Sweden (SW), and Australia and New Zealand (ANZ). FR, France; IT, Italy; SP, Spain; GE, Germany; UK, United Kingdom; CA, Canada.

