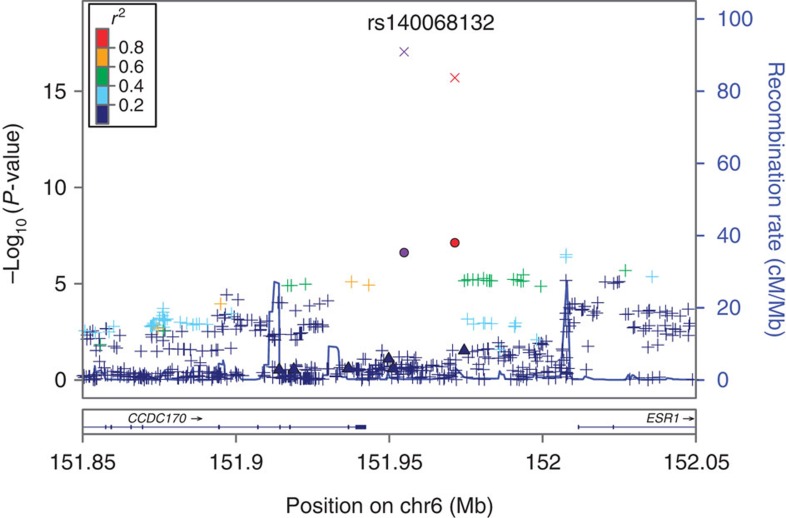
Figure 3. A regional plot of the −log10 P values for SNPs at 6q25.1.
The SNP with the highest −log10 P value is coloured purple and identified by its rs no. on top of the graph. The two SNPs that were replicated in multiple independent samples are circle-shaped, updated −log10 P values after meta-analysis are X-shaped, and previously reported risk SNPs are triangle-shaped. All other SNPs are represented by crosses and the colours reflect the level of correlation with the SNP with highest −log10 P value. The LD is estimated using data from 1,000 Genomes Project Amerindian populations. In addition, shown are the SNP Build 37 coordinates in megabases (Mb), recombination rates in centimorgans (cM) per megabase (Mb) and the name and location of genes in the UCSC Genome Browser (below).

