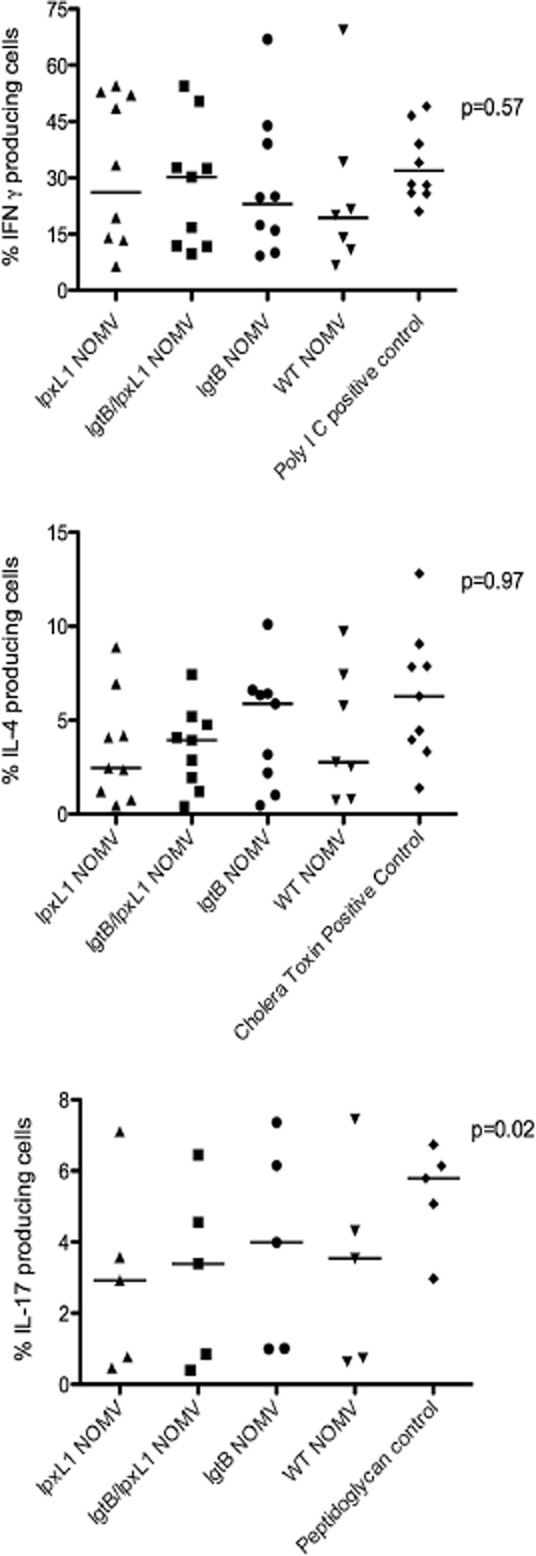
Figure 7.

The effect of NOMV stimulated DC on Th1, Th2 and Th17 responses. To assess the generation of Th1 and Th2 responses naïve CD4+ T-cells were co-cultured with NOMV-stimulated DCs (1 μg ml−1 for 18–24 h) for 12 days in the presence of IL-2 and 100 pg ml−1 SEB. On the 12th day T-cells were restimulated with 10 ng ml−1 PMA and 1 μg ml−1 ionomycin for 5 h, cells were then analysed by flow cytometry for the production of IFN-γ and IL-4 (Th1 and Th2 skewing cytokines respectively). To assess Th17 cell responses NOMV-stimulated DC (1 μg ml−1 for 18–24 h) were co-cultured with memory CD4+ cells for 5 days in the presence of IL-2 and SEB. T-cells were then stimulated with PMA and ionomycin and then analysed by flow cytometry for IL-17 production. Each point on the graph represents each separate donor and the mean of each group is also shown. Statistical significance was determined by a Friedman test. Significant differences are indicated on the figure.
