
Figure 5.
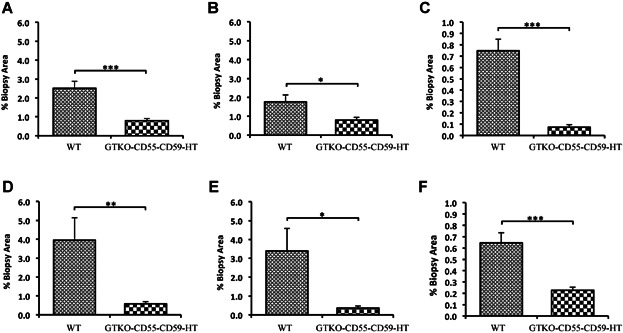
Reduction in total clot formation (A and D), including both red blood cell sequestration (B and E) and fibrin deposition (C and F), in GTKO/CD55-CD59-HT NICC versus WT NICC xenografts. Quantitative computer image analysis was used to quantify the degree of thrombosis around the grafts at 1–3 h (A–C) and up to 8 h (D–F) posttransplant. Data are shown as mean ± SEM of the total percentage of the biopsy area. *p ≤ 0.05, **p ≤ 0.01, ***p ≤ 0.001. GTKO/CD55-CD59-HT, GTKO pigs expressing human CD55, CD59 and α1,2-fucosyltransferase (H-transferase, HT); NICC, neonatal islet cell clusters.