Figure 7.

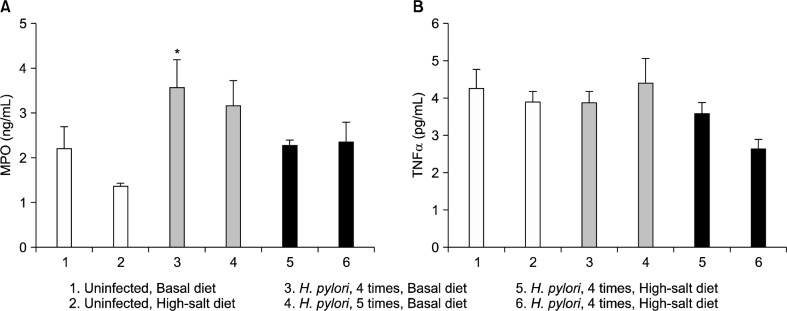
Gastric mucosal myeloperoxidase (MPO, ng/mL) (A) and tumor necrosis factor alpha (TNFα, pg/mL) (B) levels according to the diet, Helicobacter pylori (H. pylori) infection status and the number of inoculations. *P<0.05 vs. uninfected group.

Gastric mucosal myeloperoxidase (MPO, ng/mL) (A) and tumor necrosis factor alpha (TNFα, pg/mL) (B) levels according to the diet, Helicobacter pylori (H. pylori) infection status and the number of inoculations. *P<0.05 vs. uninfected group.