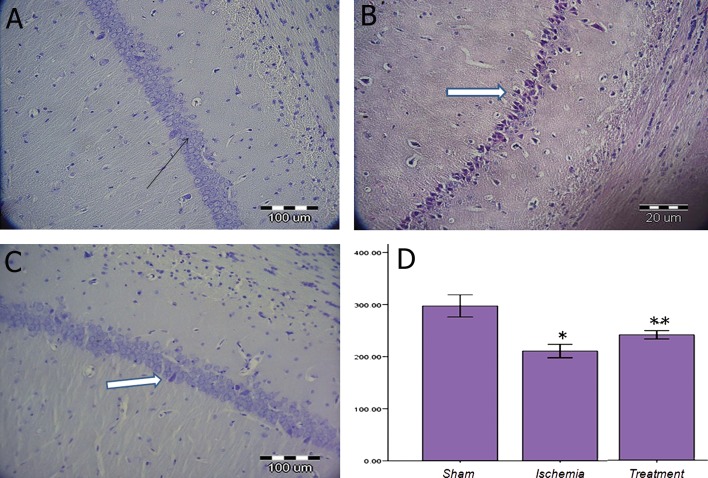
Fig 1.
Nissl staining in the sham (A), ischemia (underwent ischemia procedure) (B) and treatment (received TGF-α) (C) groups during 12 days post-surgery. Black arrow shows an intact neuron and white arrow shows the presence of dead cells or dark neuron. Data were presented as mean ± SEM.*; P<0.05 vs. sham group and **; P<0.05 vs. sham and ischemia groups.

