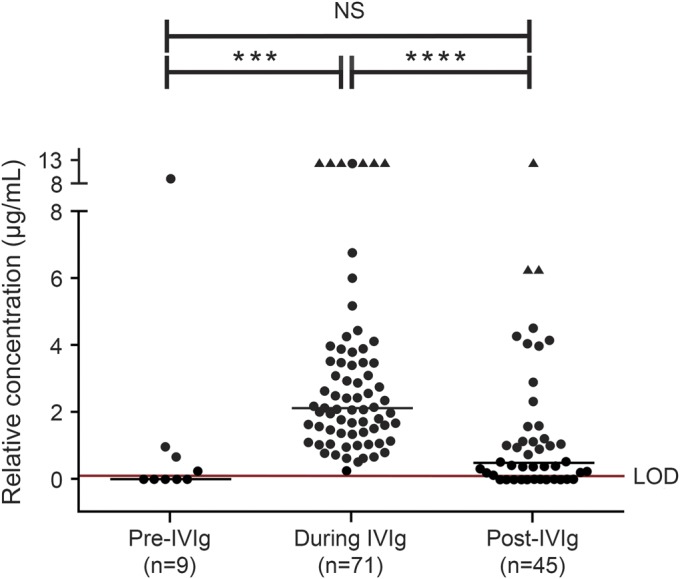
Figure 2. Relative concentration (in mAb equivalents) of JCV Ab in samples tested prior to IVIg (“pre-IVIg”), within 30 days of IVIg (“during IVIg”), and 30 days after IVIg exposure (“post-IVIg”).

Presence of John Cunningham virus antibody (JCV Ab) in samples collected pre-IVIg (n = 9), within 30 days of IVIg infusion, (“during IVIg,” n = 71), and post-IVIg (n = 45) was determined using the STRATIFY JCV and STRATIFY JCV Dx SELECT assay. The first available time point for each subject was selected. Six patients are common between the pre-IVIg and during IVIg groups, 24 patients between the during IVIg and post-IVIg groups, and 7 patients between the pre- and post-IVIg groups. The post-IVIg samples range from 31 to 746 days after the last day of IVIg dosing (median 212 days, mean 257 days). The limit of detection (LOD) red line represents the average assay cutpoint translated in monoclonal antibody (mAb) equivalents. The triangle-shaped points represent sample results with concentrations above the limit of relative quantitation possible at the sample dilution tested. Zero relative concentration represents samples that did not have detectable JCV Ab (“seronegative”). The solid line on each graph is the median of the values. The number of samples in the IVIg group is greater than in the groups that are not on IVIg. The statistical test used was one-way analysis of variance with Kruskal–Wallis analysis. IVIg = IV immunoglobulin. *** p = 0.0004, **** p < 0.0001, NS = not significant.
