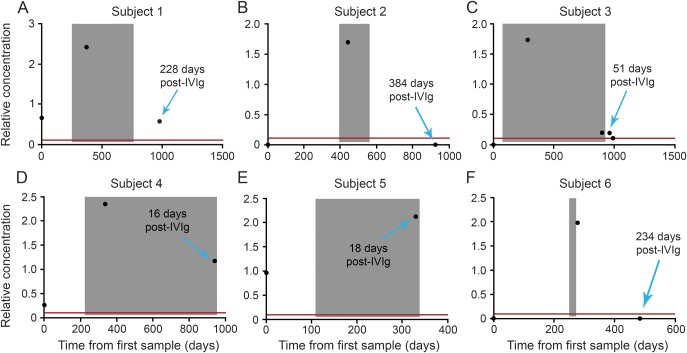
Figure 3. Effect of IVIg on endogenous relative concentration (in mAb equivalents) of JCV Ab.
Six patients shown in this figure have had John Cunningham virus antibody (JCV Ab) testing prior to initiation of IV immunoglobulin (IVIg) and within 30 days of IVIg, and patients 1, 2, 3, and 6 also had testing after stopping IVIg therapy (>30 days after last dose). “Zero” time represents the date of the first sample collected prior to IVIg treatment and is the reference point for other samples and IVIg infusion dates. The shaded area is the time between the first and last IVIg infusion plus 30 days. Zero relative concentration represents samples that did not have detectable anti-JCV Ab. The red line represents the limit of detection of assay translated in monoclonal (mAb) equivalent. All patients showed a significant rise in JCV Ab relative concentration while on IVIg, and most patients showed a significant decrease in relative concentration in mAb equivalents of JCV Ab after stopping IVIg treatment. Two of the 3 patients with appropriate available samples reverted to seronegative several months after stopping IVIg.

