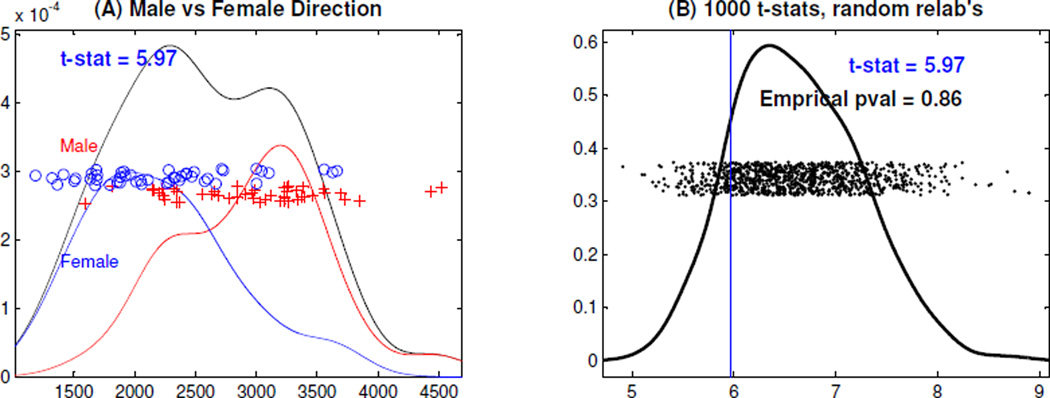
Figure 12.
DiProPerm Test on the DWD Scores. Panel (A) shows the kernel density estimates for the male (red), the female (blue), and the union (black) curves. Panel (B) is the kernel density estimate of the 1000 t-stats, generated by the 1000 random permutations, and shows the empirical p-value indicating no statistical significance.

