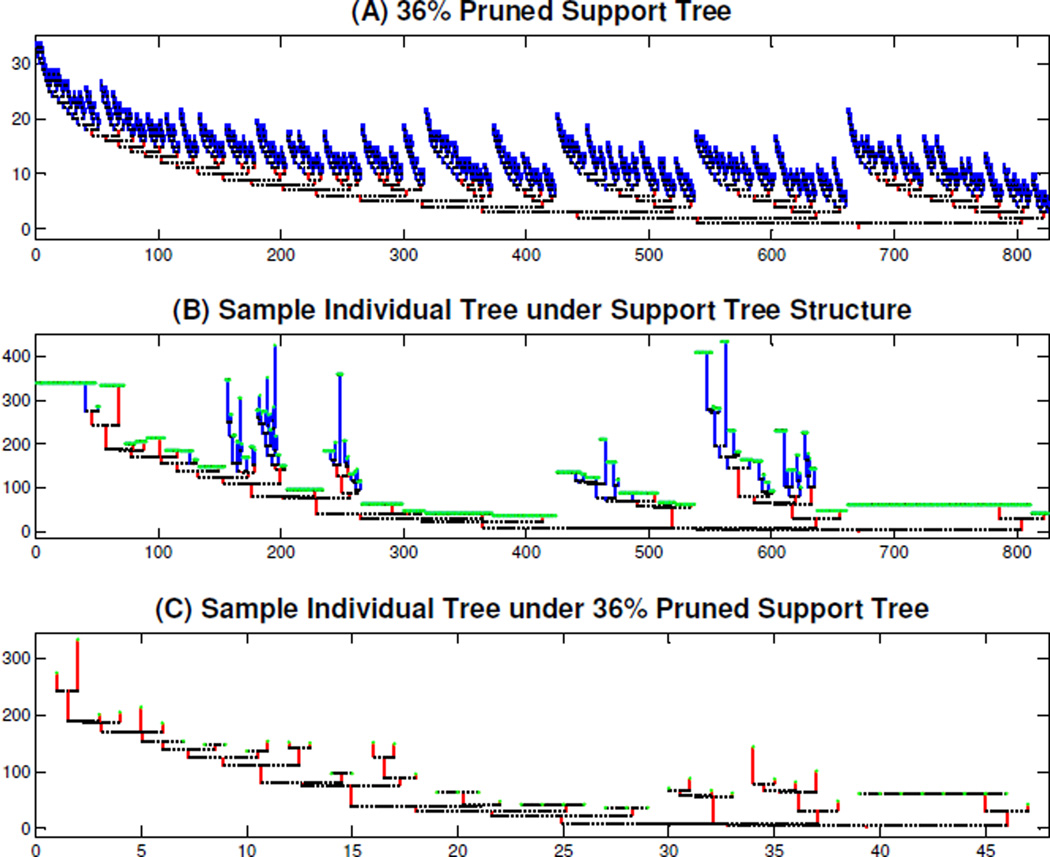
Figure 13.
Illustration of Tree Pruning, for Support Tree and an Individual. The red tree in Panel (A) is the 36% pruned support tree whose branches appear in at least 36 percent of the individual trees. Panel (B) is an individual tree under the support tree structure, where the missing branches are colored green, the non-missing branches that appear in the 36% pruned support tree are red, and the non-missing branches that are not in the pruned support tree are blue. Panel (C) is the corresponding individual 36% pruned tree that contains the red branches and the missing branches that appear in the 36% pruned support tree in the top panel.

