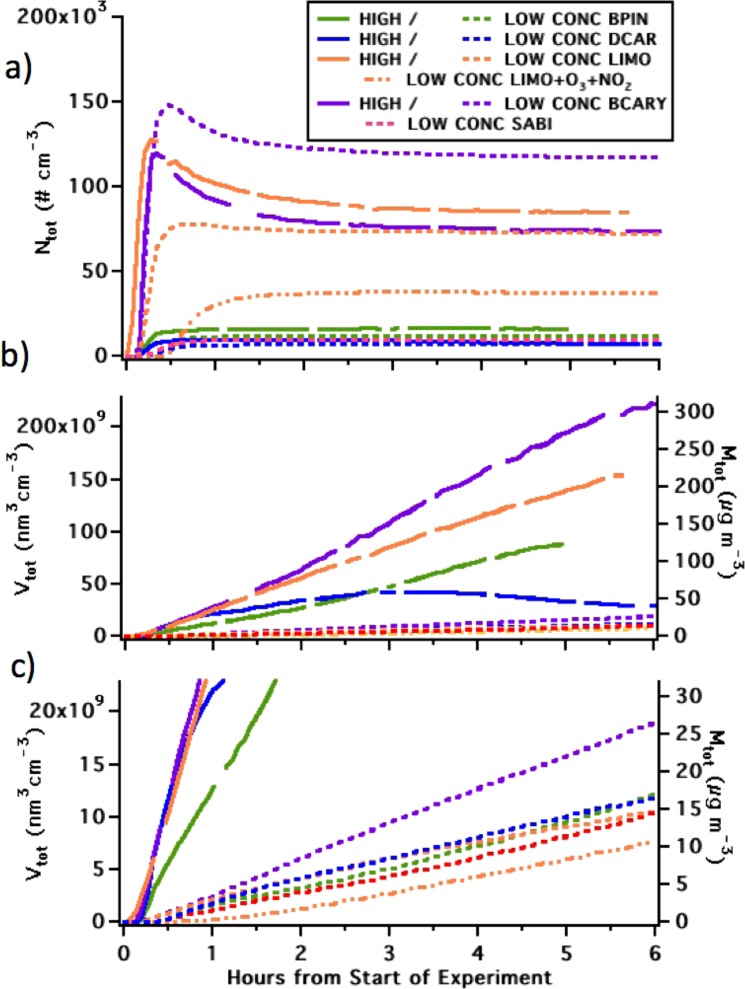
Figure 2.
Time series of total wall-loss corrected aerosol (a) particle number concentration, and (b) volume and mass concentration, from all experiments producing SOA. Panel (c) repeats (b), zoomed in on the lowest 30 μg m–3 of the y axis to show that the same pattern in volume growth is observed for the low-concentration series as for the high. LOW and HIGH indicate the nominal concentrations of BVOC and oxidant in each experiment; BPIN denotes β-pinene; DCAR, Δ-3-carene, LIMO, limonene; BCARY, β-caryophyllene; and SABI, sabinene.

