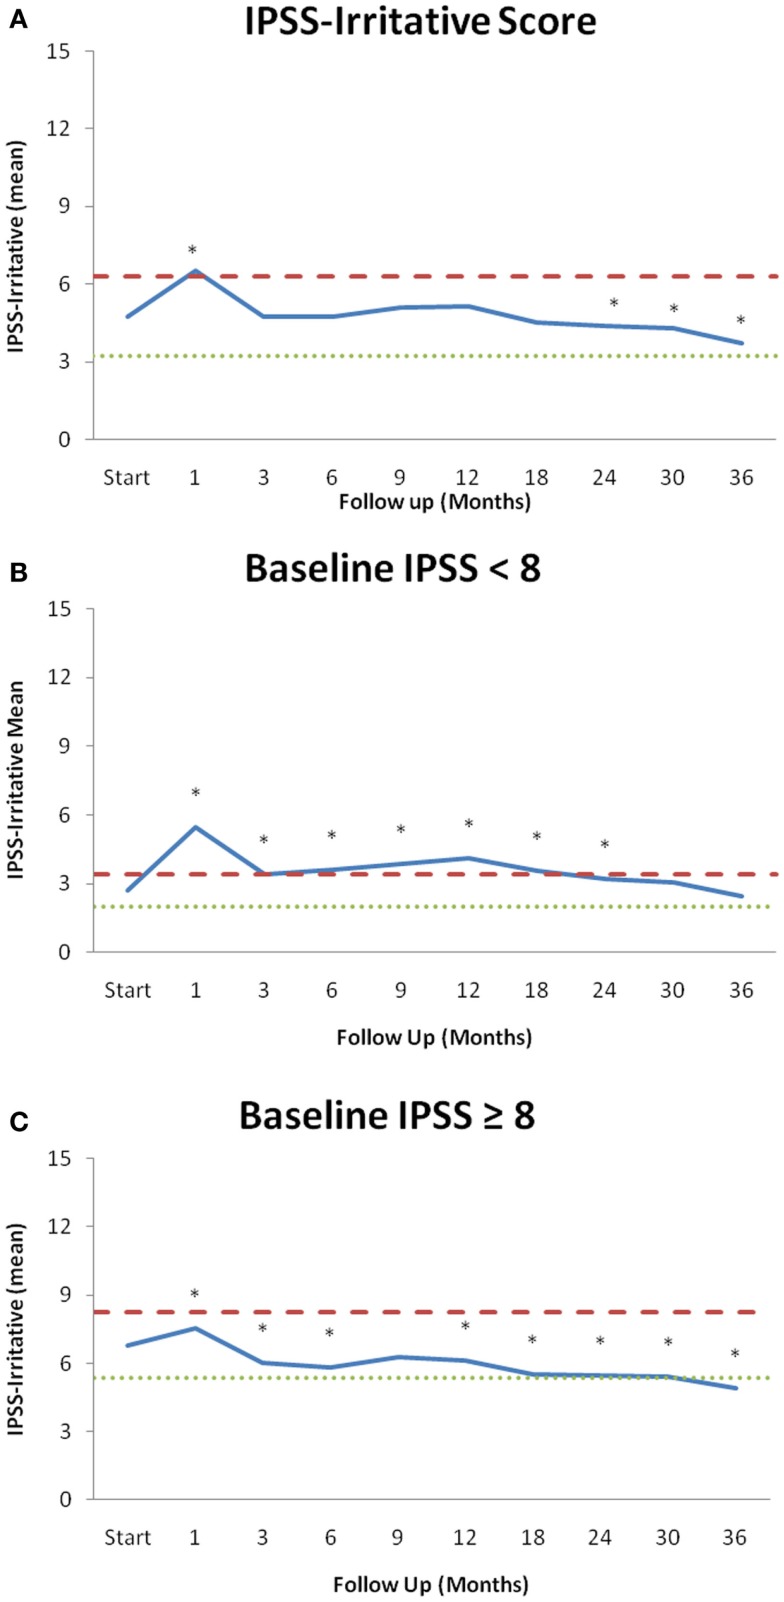
Figure 1.
IPSS-irritative subscores over the 36 months of follow-up stratified by baseline LUTS. (A) Mean IPSS-irritative score for all patients. (B) Mean values of patients with a mild baseline LUTS (IPSS < 8, n = 102). (C) Mean values of patients with a moderate to severe baseline LUTS (IPSS ≥ 8, n = 102). Changes in scores that are statistically significant different from baseline are marked with an asterisk (*). Thresholds for clinically significant changes in scores (1/2 standard deviation above and below the baseline) are marked with dashed lines. IPSS-irritative scores range from 0 to 15 with lower values representing a more favorable outcome.

