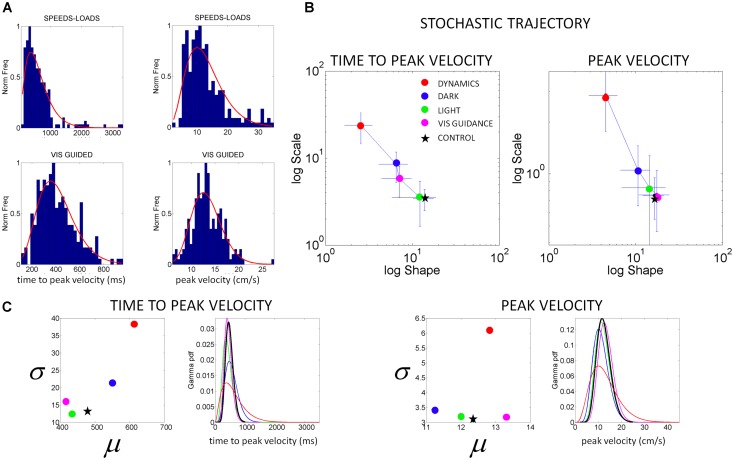
FIGURE 5.
Characterization of motor output variability in patient IW without proprioception for different reaching contexts. (A) Frequency histograms of the time to reach the peak velocity (ms) and of the peak velocity value (cm/s) for 3D pointing motions to various target locations across different speeds and loads (top) and under visual guidance in the dark (lower). Red curve is the m.l.e. fit from the continuous Gamma family of probability distributions. (B) Stochastic trajectories of the kinematics parameters in (A) obtained within the time scale of an experimental session as the patient performed pointing motions in different contexts (see legend). Each point contains over 100 measurements from reaches to all targets and repetitions of the forward and backwards pointing loop. Each point is the maximum likelihood estimate of the shape and the scale parameters of the Gamma probability distribution, with 95% confidence intervals. The estimated values for a representative typical control are shown with a black star. Shifts to the right of the Gamma plane, toward typical regimes represent gains in predictability from trial to trial. Shifts down indicate reductions in noise. (C) Estimated mean and variance were obtained from the estimated shape and scale parameters of the Gamma probability distribution. The SD for each condition in the legend is plotted as a function of the mean for the patient in relation to the representative typical control. For each of the kinematics parameters of interest we also estimated the Gamma probability density function using the range of values of the parameters experimentally obtained for each condition. Left correspond to the time to peak velocity. Right correspond to the values of the peak velocity.

