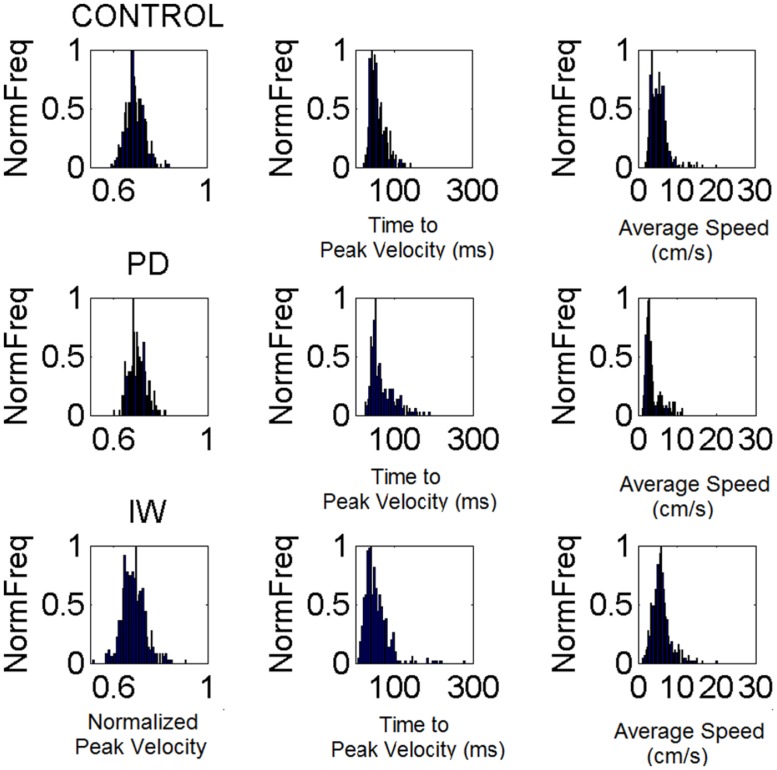
FIGURE 6.
Velocity-dependent frequency histograms from reaching data. Data are from the visually guided motions of three representative subjects whose speed profiles are shown in Figure 2, (row 1 Control, row 2 PD, and row 3 Deafferented.) The frequency histograms of the normalized maximum velocity, the time to reach this peak velocity (ms) and the averaged trial speed (cm/s) are shown in each case.

