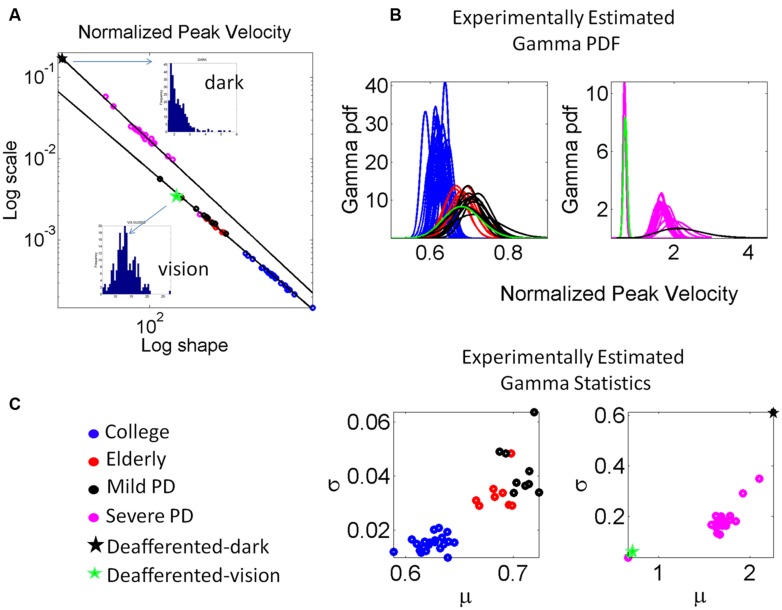
FIGURE 7.
Estimation and classification process. (A) The log-log plot of the Gamma plane shows the spread of the cohort including college students, elderly participants approximately matching the age of the PD patients, the patients in the mild, and more advance stages of PD and the deafferented subject. The deafferented subject’s data correspond to pointing motions in complete darkness (black star) and motions under visual guidance (green star). Each point is estimated with 95% confidence and represents the signature of the velocity-dependent motor output variability, specifically obtained from the normalized peak velocity. Notice the change in the slope and intercepts for the power laws revealed by the data (see details in the text.) Frequency histograms of the peak velocities of the dark and visually guided conditions for the deafferented subject are shown as insets in (A). (B) The estimated Gamma probability density function curves are obtained using the estimated Gamma shape and scale parameters and the experimentally determined range of the normalized peak velocity. Each curve corresponds to the point in (A). Left shows the mild PD group in relation to elderly and young controls. Right shows the group with more advanced PD using as anchors the data from the deafferented patient while pointing in the dark and with visual guidance. (C) Estimated mean and variance to obtain the SD and automatically classify the participants. Notice that higher values of μ correspond to lower values of averaged hand speed in the denominator term of the normalized peak velocity index (see text for the definition of normalized peak velocity.)

