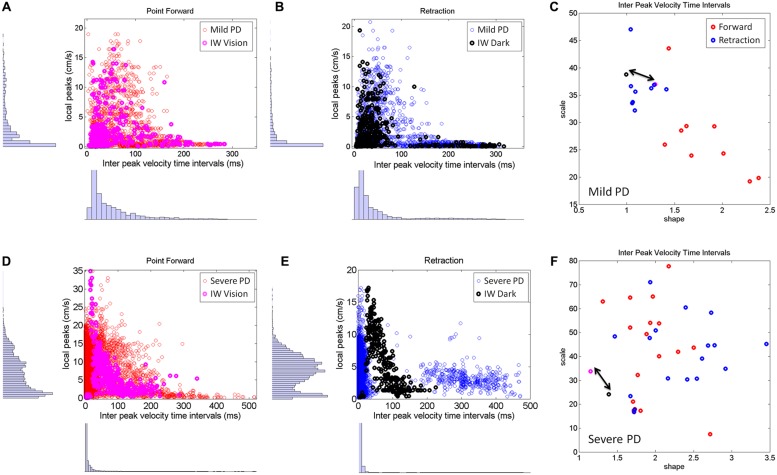
FIGURE 8.
Differences between mild and severe PD patients in the inter-time intervals of local velocity peaks. (A–C) Statistical features of temporal dynamics from mild PD patients’ forward pointing motions and retractions in relation to IW in the visually guided condition. Scatters of all local velocity peaks as a function of the inter time intervals between local peaks with frequency histograms corresponding to the values of these local peaks (y-axis) and their inter time intervals (x-axis). (C) The Gamma plane scatter of the mild PD patients’ signatures of the inter time intervals of the local velocity peaks. Notice that points corresponding to the retractions are in the noisier and more random region of the Gamma plane where IW’s (both forward and retracting) motions fall (marked by the double arrow). The points corresponding to the forward pointing motions separate from those corresponding to the retractions in all (but one) mild PD patients. (D–F) Similar plots as (A,B) corresponding to severe PD patients in relation to IW in the dark condition. Note the difference in scatter and multimodality of the y-axis frequency histograms (see text for additional details). (F) The scatter of points of the severe PD patients in the Gamma plane do not distinguish between forward and retracting motions. Notice that the majority of the patients have noisier patterns of inter peak time intervals than IW. Notice as well that IW patterns are at the exponential end (random and memoryless probability distribution) of the Gamma plane.

