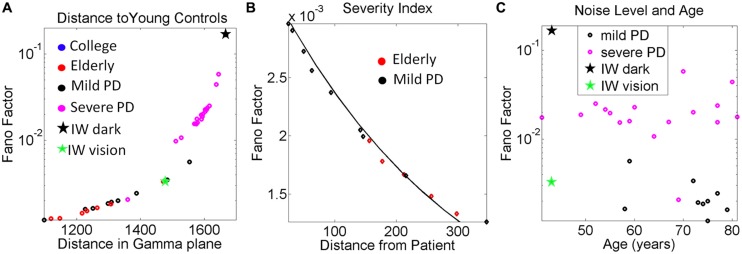
FIGURE 9.
Other variability dependent indexes to quantify the relations between motor output variability and proprioceptive deficits. (A) Systematically measuring the distance in the Gamma plane between each participant and the centroid location of the young control group reveals an exponential increase in the noise levels (measured by the Fano Factor, the ratio of estimated variance over estimated mean) as the participant is farther apart from the young controls’ centroid. (B) Zooming in the mild PD provides a putative index of severity even at that mild stage of PD to quantify decrease in kinesthetic sensing relative to the deafferented subject according to noise levels in the motor output variability. The exponential relation of this segment has a shift in slope and intercept with respect to the severe PD group (see text for details and Figure 6). In both groups the closer the stochastic signature of the velocity-dependent motor output variability of the person is to the deafferented subject, the noisier the signal of that person is (higher Fano Factor value). (C) Noise to signal levels (Fano Factor) as a function of age in Mild PD vs. severe PD patients.

